Summary
- With more than 2.9 million passengers flying on the many non-stop flights, New York JFK-London Heathrow was number one, exactly as you would expect.
- The UK's busiest airport appeared four times in the top 10.
- San Francisco to Taipei was the only Asian market to feature.
More than 227 million passengers flew internationally to/from the US in the 12 months to October 2023, the most recent month available. This is a finding based on examining US Department of Transportation T-100 data.
The USA's top 10 international markets
The ten busiest routes are summarized in the following table. Note that:
- They are based on non-stop services, with the stated traffic figures combining all airlines and the passengers who flew them
- Figures include both point-to-point passengers (where they only flew between the two airports or cities) and those who connected to another flight over one or both airports

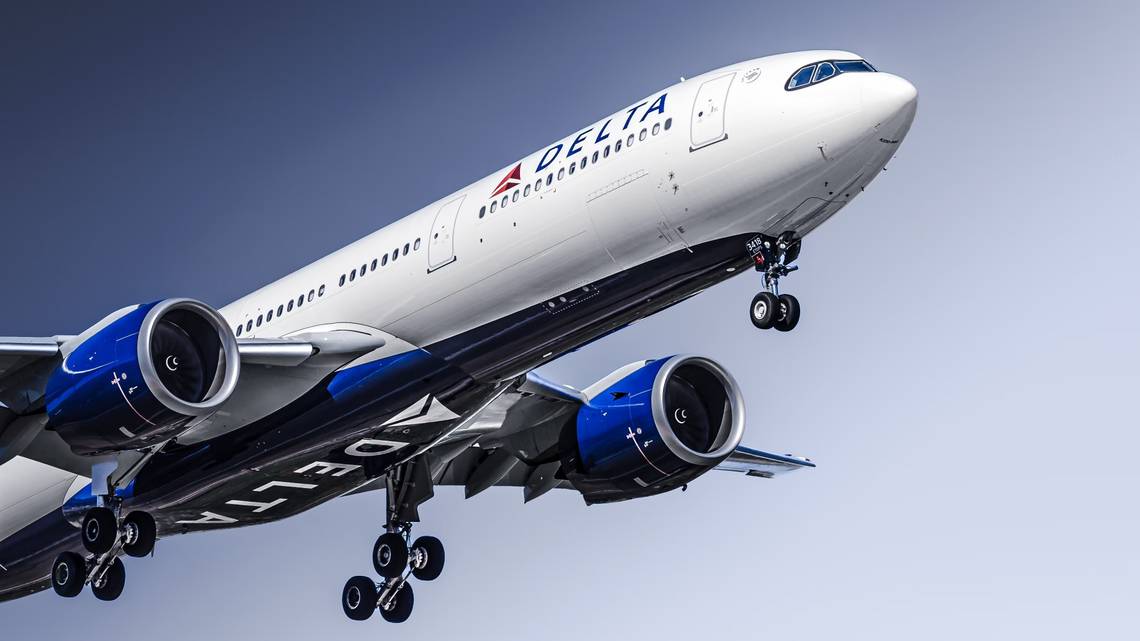
While not surprising, New York JFK to/from London Heathrow was very firmly number one. Served by American Airlines, British Airways, Delta Air Lines, JetBlue, and Virgin Atlantic, the five carriers collectively had just a 79% seat load factor (SLF) in the examined period. If spread across the year, ~8,000 passengers flew daily, excluding seasonality, although as always, SLF must not be considered in isolation of fares and yields.
Market | Roundtrip passengers: 12 months to Oct. 2023** | No. of carriers in this period** | #1 airline (% of passengers) |
|---|---|---|---|
New York JFK-London Heathrow | 2.914 million | Five | British Airways (37%) |
New York JFK-Paris CDG | 1.725 million | Five | Air France (61%) |
Los Angeles-London Heathrow | 1.574 million | Five | British Airways (32%) |
New York LaGuardia-Toronto Pearson | 1.145 million | Four | Air Canada (53%) |
Dallas Fort Worth-Cancun | 1.116 million | Four | American (73%) |
Los Angeles-Guadalajara | 1.032 million | Four | Volaris (59%) |
San Francisco-London Heathrow | 1.028 million | Three | British Airways (40%) |
San Francisco-Taipei | 1.019 million | Three | EVA Air (52%) |
Newark-London Heathrow | 1.015 million | Two | United (64%) |
New York JFK-Santiago (Dominican Republic) | 1.008 million | Two | JetBlue (68%) |
* Per T-100 data | ** Might have changed since |
A look at San Francisco-Taipei
At 6,469 miles (10,410 km), San Francisco to/from Taipei was the only one of the top 10 markets to involve Asia. EVA Air, China Airlines, and United served it in the examined period (Starlux joined them in December 2023, so it was not included in the above figures.)

The trio carried 1.019 million roundtrip passengers in the 12 months to October, equivalent to a non-seasonalized ~2,800 daily. Spreading the year's passenger volume over the number of flights shows that each service had about 312 passengers.
With a typical 343 seats per flight, the market had a load factor of 90%. Of course, this high-level examination hides all the usual variations by month, season, airline, etc.

Air India Carried More Than 1 Million US Passengers In 2023
These were its busiest routes in the year to October.Where passengers went
When EVA Air, China Airlines, and United are combined, the 1.019 million passengers can be broken down as follows. Again, it is an analysis of the market rather than the airline level, so figures would obviously differ per carrier.
- 38% of passengers connected to another flight in Taipei (Manila was #1)
- 27% of passengers only flew between San Francisco and the Taiwanese capital
- 22% of passengers transferred to another flight in San Francisco (Phoenix was #1)
- 13% of passengers transited to another flight in San Francisco and Taipei
What are your thoughts on the busiest international routes to/from the US in 2023? Let us know in the comments section.