Summary
- Newark to San Francisco was United's top route, with over 1.23 million passengers and an average of 4,100 daily.
- More than seven in ten passengers were local; such is the enormity of the two metro populations it serves.
- Houston Intercontinental-Cancun was the carrier's top international route.
United Airlines carried about 138 million passengers between January and October 2023, the latest month available to me on a fully broken down route-by-route basis. That is based on examining US Department of Transportation T-100 data. With a typical 4,135 daily movements (take-offs and landings combined) in these 10 months, it averaged 110 passengers per flight.
United's top 10 routes
Examining T-100 traffic information indicates that United's busiest airport pairs, by the number of passengers, are as detailed in the following table. While there are few surprises, it is good to see the numbers. Note that the stated figures include everyone, whether point-to-point (local) or connecting over one or both hubs.
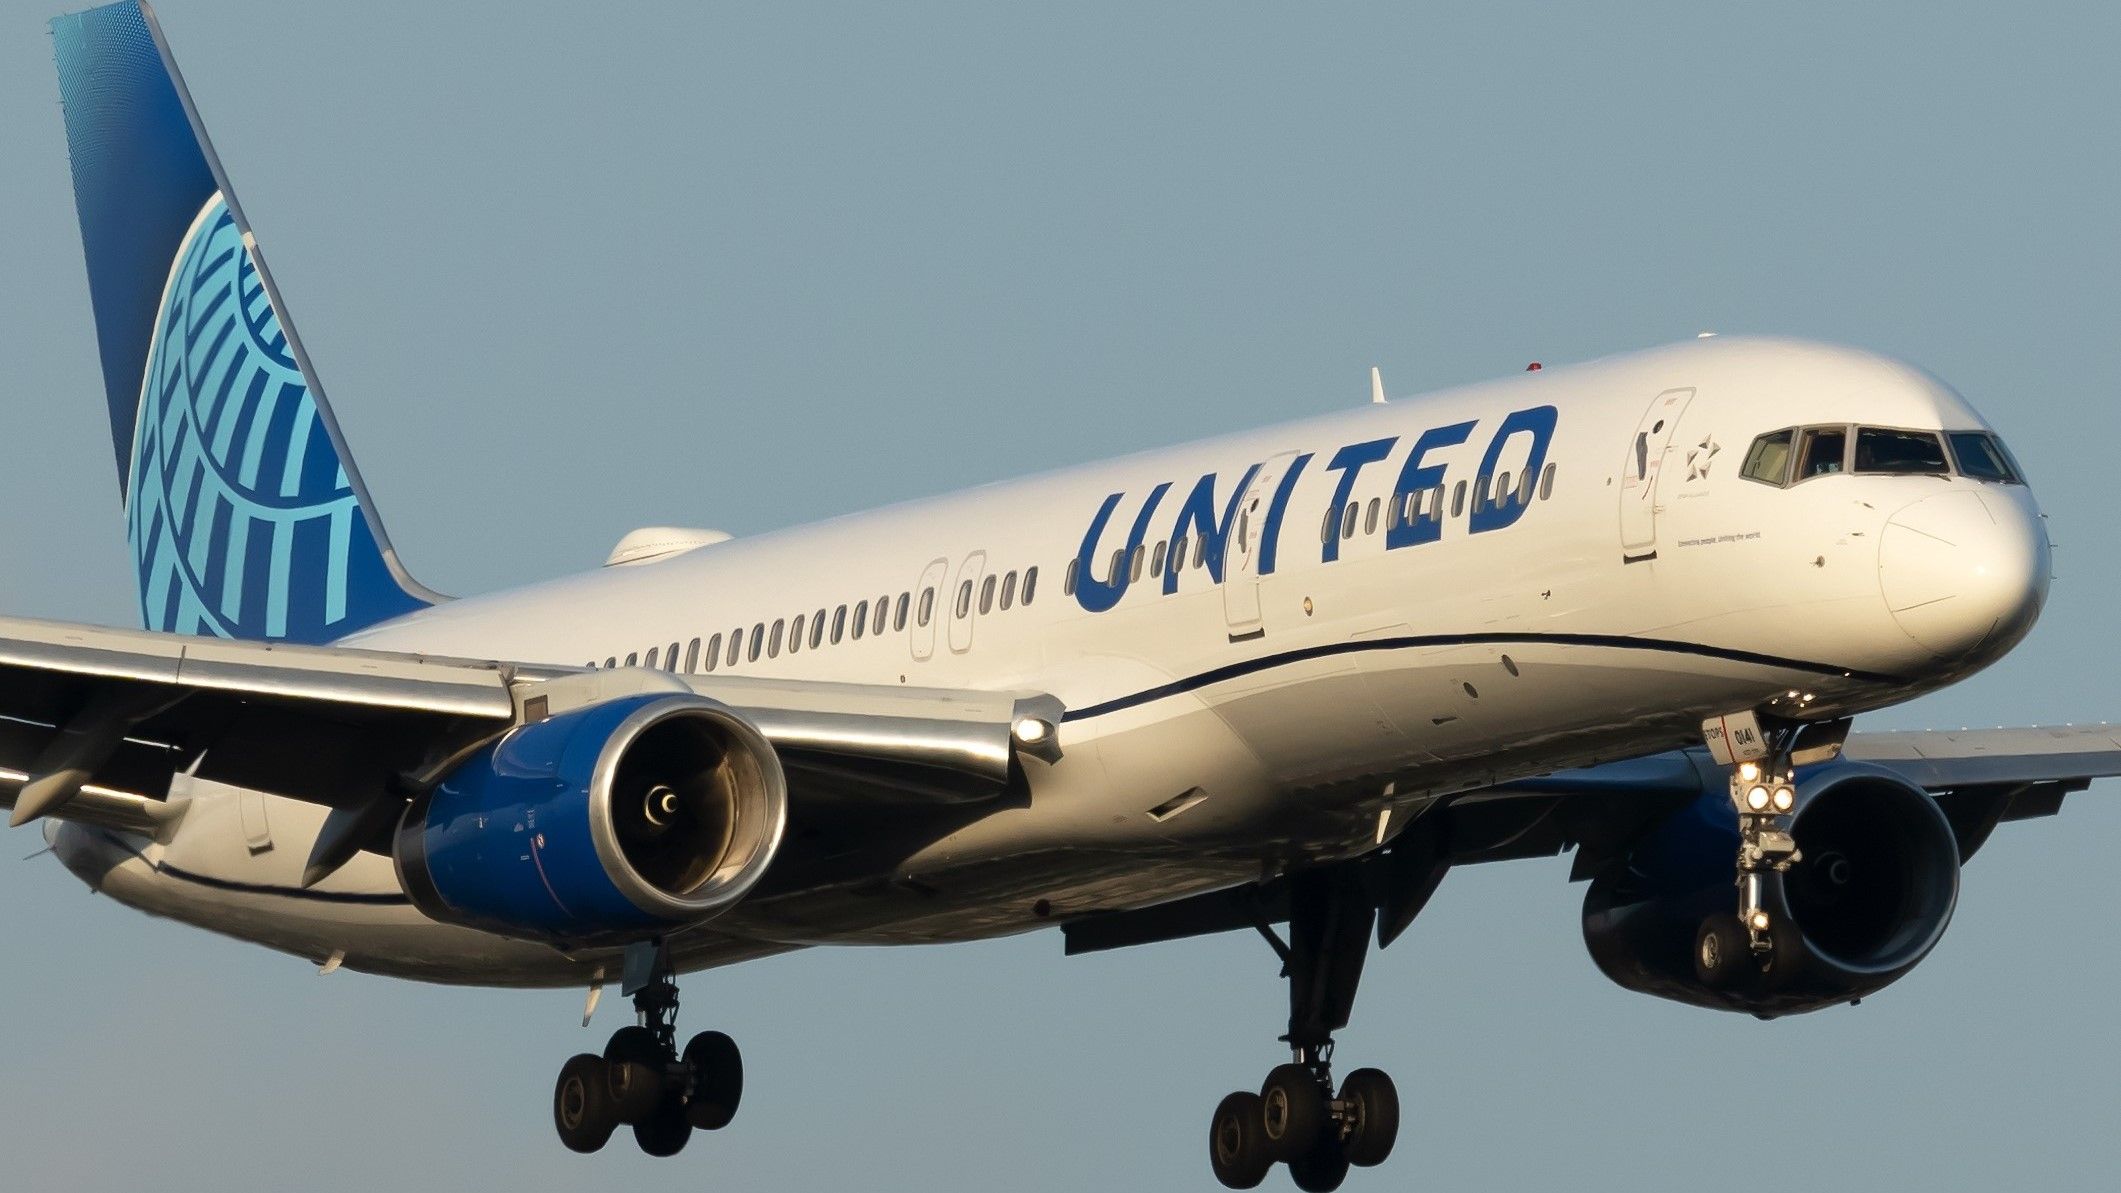
Newark to San Francisco had more passengers than any other route, and it was the only one with 4,000+ daily passengers. With approximately 18 daily movements, each service, across the whole period, had around 226 passengers onboard. Cirium shows that the 777-200, 757-200, 777-300ER, 787-10, and 787-9 were used.
It is estimated that over seven in ten passengers (71.30%) were local: they only flew between the two airports. It means about 2,911 people daily, while the remaining passengers (1,189) transited to another flight in Newark or San Francisco or both. Booking data shows that more people transferred in San Francisco. Newark-Honolulu was the largest origin and destination, followed by Newark-Seoul Incheon.
Routing | Passengers: January to October 2023* | Average daily passengers** | Seat load factor |
|---|---|---|---|
Newark to San Francisco | 1,232,410 | 4,100 | 86.5% |
Chicago O'Hare to Denver | 1,138,007 | 3,756 | 86.8% |
Chicago O'Hare to San Francisco | 1,131,608 | 3,735 | 87.7% |
Newark to Los Angeles | 1,051,272 | 3,470 | 87.8% |
Denver to Houston Intercontinental | 1,022,668 | 3,375 | 87.0% |
Chicago O'Hare to Los Angeles | 1,003,110 | 3,311 | 88.8% |
Newark to Orlando International | 965,405 | 3,186 | 87.0% |
Denver to San Francisco | 955,503 | 3,153 | 86.5% |
Newark to Chicago O'Hare | 914,589 | 3,018 | 88.1% |
Houston Intercontinental to San Francisco | 910,178 | 3,004 | 85.5% |
* Roundtrip | ** Across the whole period based on non-rounded numbers |
What about international?
United had more than 280 non-stop international routes with 1,000+ passengers in the analyzed 10 months. Perhaps unsurprisingly, Houston Intercontinental-Cancun was number one. It had 558,351 passengers (about 1,843 daily) and filled 85.1% of the available seats. Next was Newark-London Heathrow, Houston-Mexico City, Newark-Tel Aviv, and San Francisco-Heathrow.
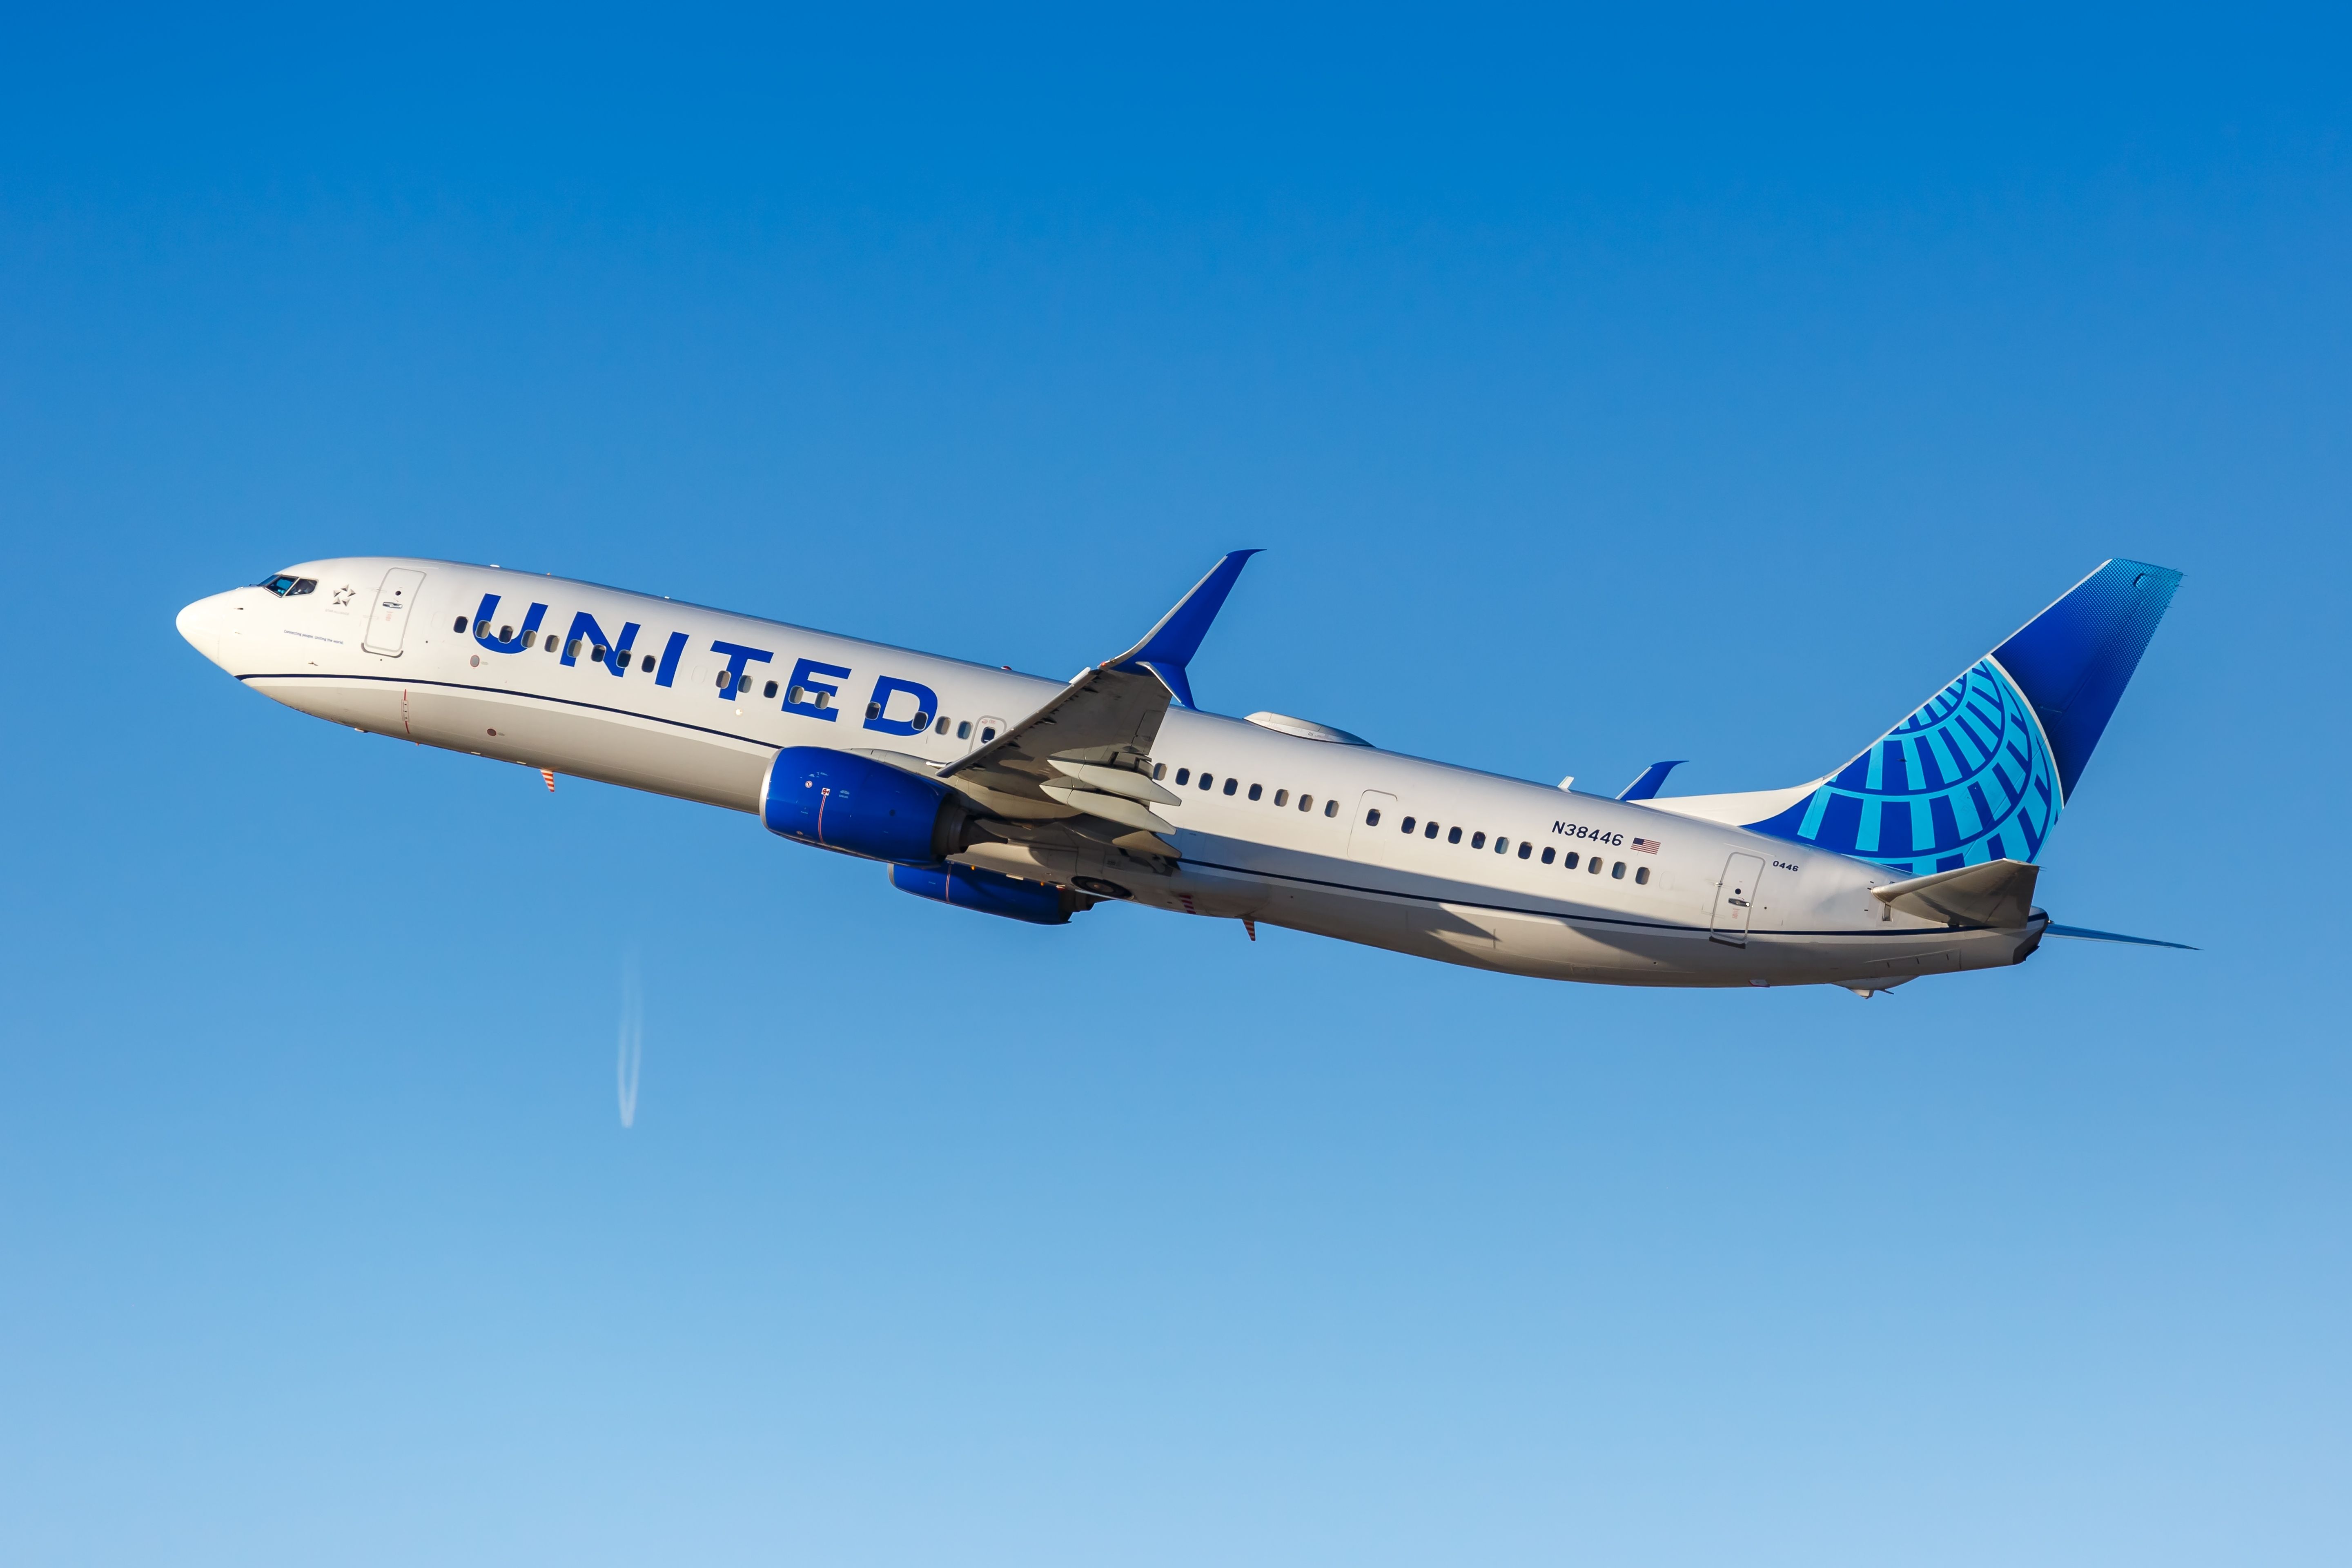
Houston-Cancun had a typical 12 daily movements, although there were 16 daily on 28 occasions from June to September. The 737-900ER (shown above) was very much the most-used equipment, followed by the MAX 9 (which cannot be used now) and the 364-seat, high capacity, non-ER, domestic 777-200. The latter began on October 29th and continues to be used twice daily.
Did you fly any routes mentioned in this article in the analyzed period? If so, let us know in the comments section.


